Reduced Data Products
All of IGRINS data included in the Reduced version of RRISA have been reduced using the v3 of the IGRINS PLP. The Reduced version of RRISA includes three names for each of the targets: the hand corrected name, the superlog name, and the recipe name. The superlog name (OBJNAME in Raw, OBJNAME_super in Reduced & XMatch) is the user input target name and can be used to search for the same object in all three of the RRISA sheets. The hand corrected name can be used to search for the same object in the Reduced & XMatch sheets. The superlog name and the recipe name will not always match, but usually they are similar or alternate identifiers for the same object. If users find anything that appears to be a misidentification we ask that they report it by raising a GitHub issue or contacting us at igrins.contact[at]gmail.com. Finally, not all of the reduced IGRINS data is necessarily good quality. If you use the reduced data products, consult the observing logs and reach out to the IGRINS team if you have questions!
Data Reduction
IGRINS reduced data have been processed with the IGRINS Pipeline Package (PLP) v3 from Kaplan+ 2024. The PLP follows standard reduction techniques for echelle spectra including flat fielding, readout pattern removal, cosmic ray removal, combining individual exposures, rectification, and extraction of the individual echelle orders.
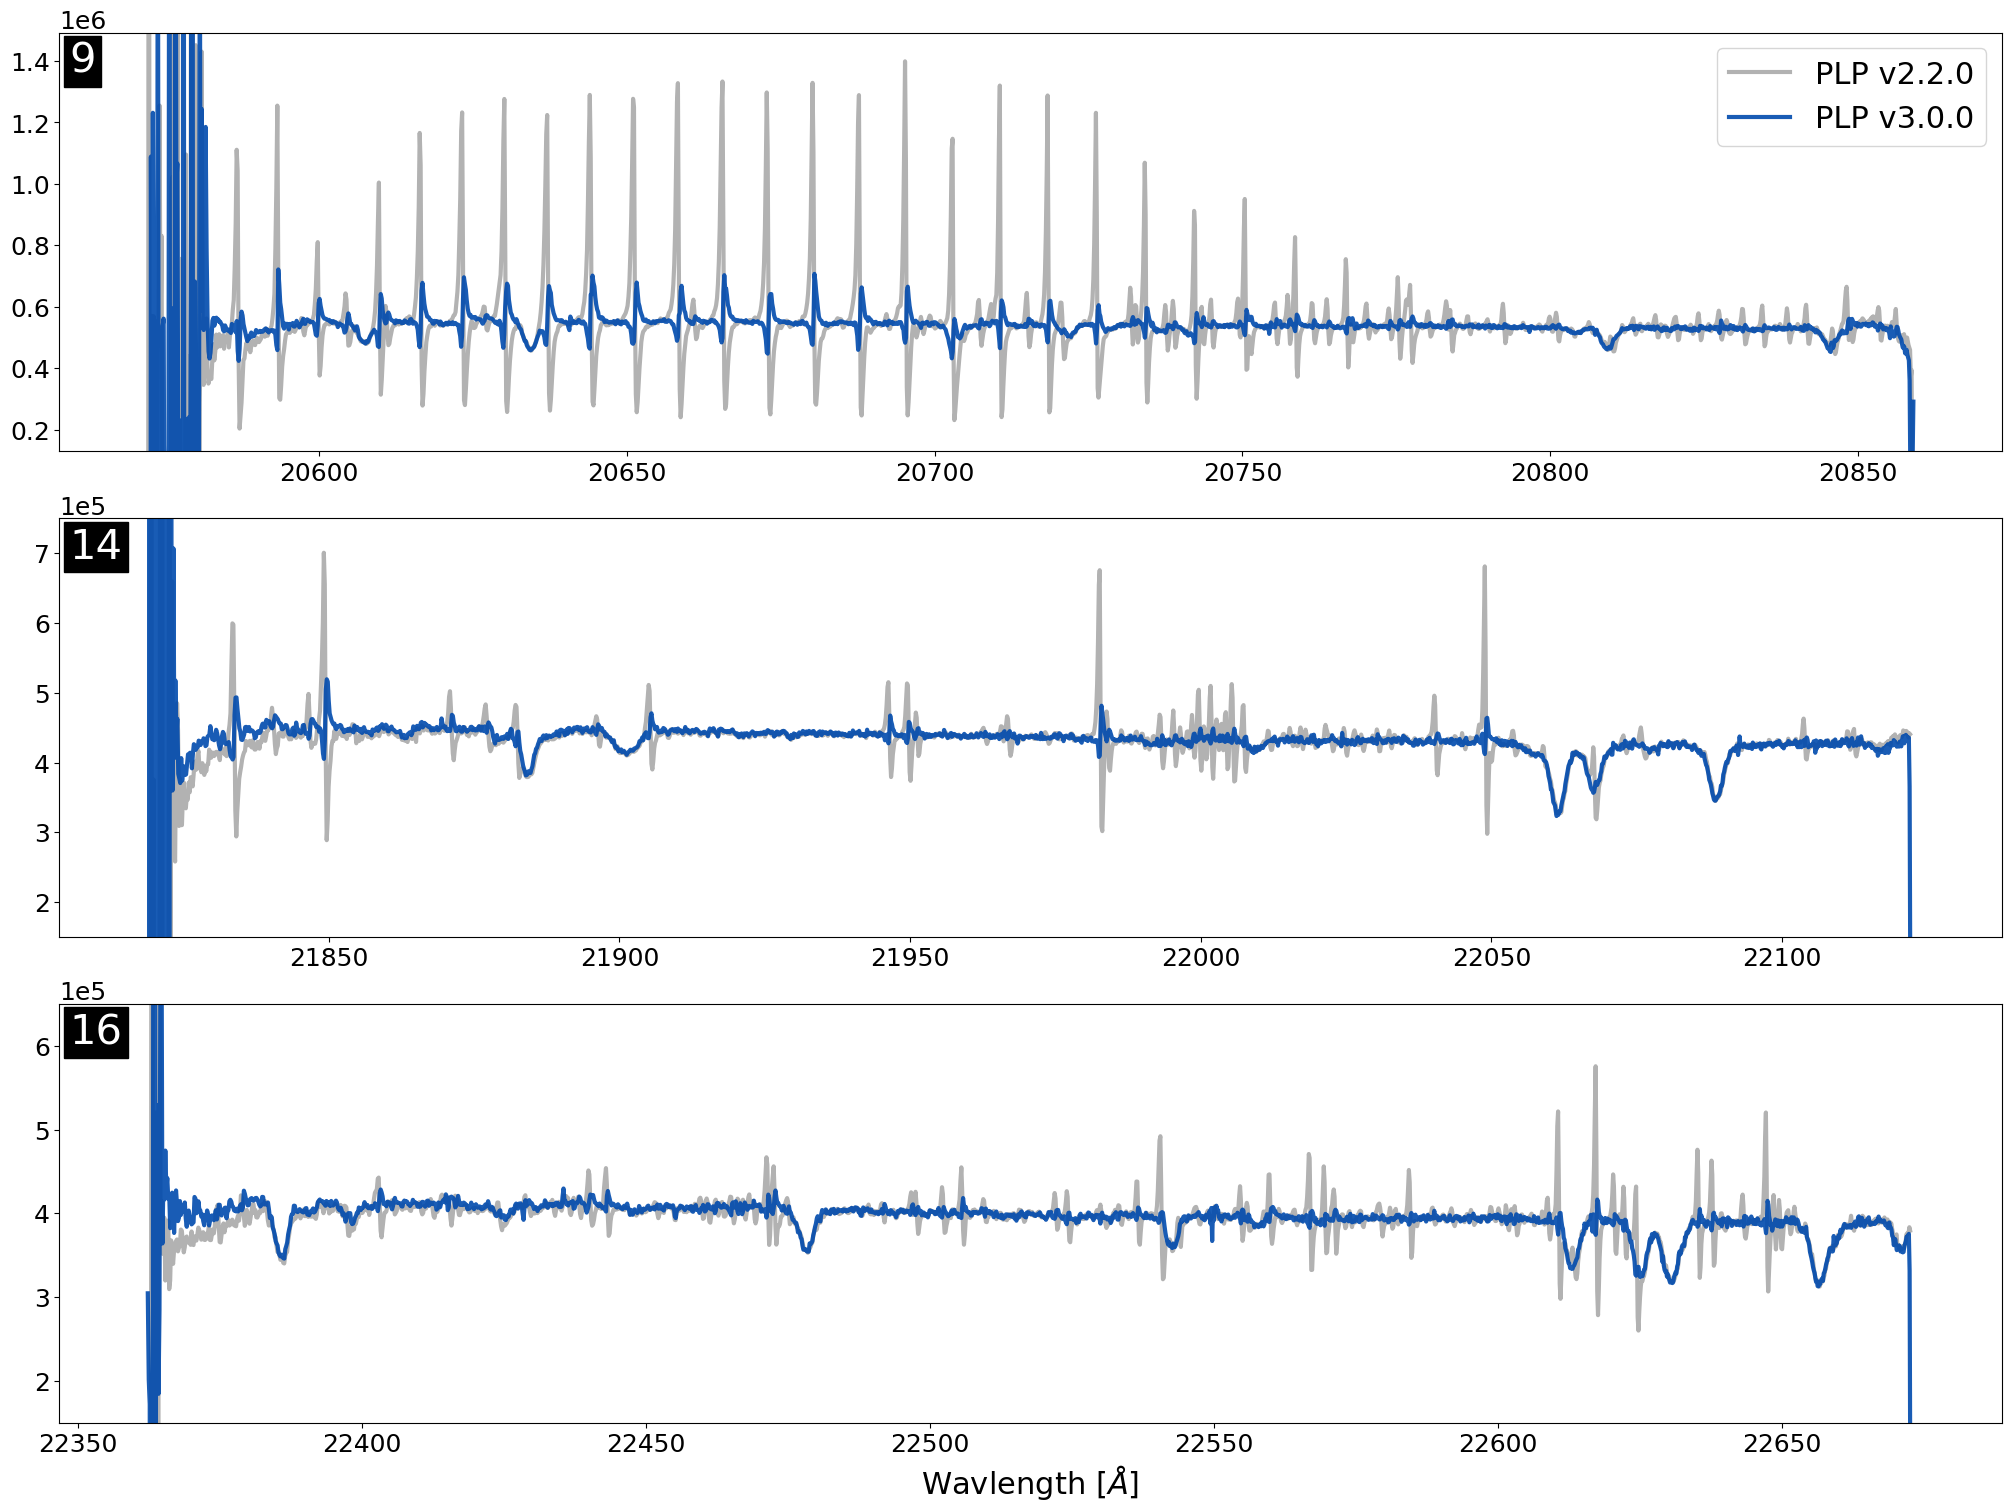
The PLP v3 introduces a new method of flexure correction that improves the OH sky line background subtraction and reduces the telluric residuals that appear when stacking individual frames and when dividing a target spectrum by its standard star. In a night of observing, we compare the location of the OH sky lines in each raw frame (with OH sky lines) used in reduction to the location of the OH sky lines in the first sky frame of the night to measure the flexure in each frame. After measuring the flexure in each of the frames used in the reduction, the PLP continues through the various recipe steps but both cosmic ray masks and flexure corrects the frames used in the recipe before stacking them. An example of the difference between the new and old pipeline reduction for a night with high flexure is shown below for a few orders in K-band.
Originally, IGRINS used a calibration unit installed that permitted nightly observations of ThAr arc lamps for wavelength calibration. Since IGRINS has no moving optics, it has a fixed spectral format that changes on the order on <1 pixel per night and <5 pixels over a year. The wavelength solution for IGRINS data comes from an initial guess based on the historical wavelength solution. This initial guess is then refined using sky OH emission features in a 300s sky frame taken each night on the telescope. Sky frames from adjacent nights also provide reliable wavelength solutions and are sometimes used when no sky frame is available for a night.
Telluric standards are generally A0V stars, which are Vega corrected using a model of the Vega spectrum (see the file in the PLP, but also stored in each spec_a0v.fits file as an extension) to remove the deep and broad H2 absorption features. This process is not perfect and can leave residual features due to differences in the line widths and radial velocities of the telluric stars relative to the Vega model. Additionally, the model Vega spectrum is not meant for careful flux calibration science cases, but is appropriate for science cases where the target spectrum is continuum normalized. When using PLP data for science pertaining to individual line strengths, users should compare the spectrum to that of the A0V, the Vega model and the Earth transmittance spectrum.
The PLP v3 output has changed when compared to past versions of the PLP. The most signification change affects the spec_a0v.fits files, where more extensions are included to reduce the number of files a user needs to keep on their device. For consistency with legacy codes, several of the extensions in spec_a0v.fits are also included as individual files. When downloading reduced data using RRISA, the following files are included in each zip file (for H- and K-band) corresponding to a particular file number:
- spec_a0v.fits: The target spectrum telluric corrected by the Vega corrected A0V. This FITS file includes the original data used to create the reduced spectrum. Each extension is a 2048x28 array with the same header. The differences between each of the EXTNAMEs are:
- [0]-Primary: Only contains the header with information about the observation
- [1]-SPEC_DIVIDE_A0V: The corrected target spectrum = (TGT_SPEC/A0V_SPEC)*VEGA_SPEC. This spectrum is roughly telluric corrected and relatively flux calibrated.
- [2]-SPEC_DIVIDE_A0V_VARIANCE: The variance of SPEC_DIVIDE_A0V (per pixel) propagated from the variance in the individual target and standard spectrum.
- [3]-WAVELENGTH: The wavelength solution from the OH sky lines (in um)
- [4]-TGT_SPEC: The extracted target spectrum (same as in spec.fits file)
- [5]-TGT_SPEC_VARIANCE: The variance of TGT_SPEC (per pixel).
- [6]-A0V_SPEC: The extracted A0V spectrum used for the standard star division. The observation ID (file number) for the A0V used is available as the ‘OBSID’ keyword in the header for this extension.
- [7]-A0V_SPEC_VARIANCE: The variance of A0V_SPEC (per pixel).
- [8]-VEGA_SPEC: A model of the Vega spectrum (see the file in the PLP or for more detailed info regarding the file see this link).
- [9]-SPEC_DIVIDE_CONT: Similar to SPEC_DIVIDE_A0V, but the target spectrum is divided by the estimated continuum of the A0V star instead of the A0V spectrum itself. The resulting spectrum is relatively flux calibrated but not telluric corrected.
- [10]-SPEC_DIVIDE_CONT_VARIANCE: The variance of SPEC_DIVIDE_CONT (per pixel).
- [11]-MASK: The pixels used in the A0V star continuum fit for SPEC_DIVIDE_CONT. A value of 1 is not used in the continuum fit.
- sn.fits: The signal-to-noise (per resolution element) for the extracted 1D spectrum. We recommend using .variance.fits for the uncertainty. Columns are x pixel position on the detector and rows are echelle orders.
- spec.fits: The extracted 1D spectra. Columns are x pixel position on the detector and rows are echelle. The pixel values are the extracted counts.
- spec2d.fits: The 2D spectrum stored as a data-cube of the rectified echelle orders. The x-axis is pixel across the detector and y-axis is the spatial axis along the IGRINS slit. The pixel values are detector counts.
- var2d.fits: The variance (per pixel) of the 2D spectrum. The x-axis is pixel across the detector and y-axis is the spatial axis along the IGRINS slit.
- variance.fits: Variance for the 1D spectra in spec.fits. Columns are x pixel position on the detector and rows are echelle order. The pixel values are the extracted counts.
- slit_profile.json: The average measured slit profile for a target AB nodded on the slit. The array labeled “profile_x” is the fractional distance across the slit and “profile_y” is the slit profile of the target. This is the slit profile used for optimal extraction explained more here.
- 1d_plots.pdf: The SPEC_DIVIDE_A0V extension of spec.a0v.fits plotted by order. The y-axis limits of each order are set using the 99th flux percentile of the trimmed order, but usually this is not ideal for anything other than quick-looking the quality of the telluric correction.
There are additional files output by the IGRINS PLP available upon request detailed here.
Note: The output files from the IGRINS PLP are an in-vacuum wavelength solution. Fit models are offset from expected line positions by 80-120 km/s the models are likely in air and not vacuum. The IAU standard conversion for air to vacuum wavelengths is given by Morton 1991. For vacuum wavelengths (VAC) in Angstroms and convert to air wavelength (AIR) via:
RRISA Reduced
Downloadable from our GitHub as a .csv. Users can also view through Google Drive or explore the RRISA_v3 folder on Box!
For a more detailed description of the information included in RRISA Reduced, check out the the RRISA Reduced folder on our GitHub.