Raw IGRINS Files
The Raw component of RRISA is a list of all of the H-band frames (SDCH_[YYYYMMDD]_[frameno].fits) IGRINS has ever observed before May 2023 including flats, darks, arcs, targets, and telluric standards. IGRINS takes H- and K-band spectra simultaneously, so each of the logged H-band frames will have K-band (SDCK_[YYYYMMDD]_[frameno].fits) companion with an identical file number. The link corresponding to each file number will take users to a UT Box folder with all of the raw files taken on a given night which can be downloaded individually by file number or for the entire night.
Slit-viewer camera images (SDCS_[YYYYMMDD]_[frameno].fits) used for target acquisition and guiding were not saved for observations before 20150401 and are not available. Between 20150401 and 20170310, slit-viewer camera images were only saved per the observer’s discretion (due to limited hard-drive space) and are not linked with raw .spec file numbers. Users can associate SDCS images taken during this time with the raw .spec files by comparing the Julian date of observation for the .spec file with the Julian date of the SDCS image (found in the header). In RRISA Raw, we flag which dates have SDCS images available in this date rage by putting a “-1” flag in the SDCS column. The flag is followed by the number of SDCS images saved for that particular date (i.e. a night with 100 SDCS images would have the value “-1 100” in the SDCS column). After 20170310 SDCS images are associated with specific raw .spec files, when a spectrum is actively being taken. The SDCS column in RRISA Raw contains the list of all the SDCS image file numbers taken while a raw .spec file was acquired (when available). A full list of any SDCS image IGRINS has ever saved is available in the SDCS log as part of RRISA Raw. Slit-viewer camera images can be downloaded using the link in the RRISA Raw and SDCS log “RAW_URL” column. Please note that the slit-viewer camera images are not appropriate for photometry.
Some spectral files are not suitable for science. For example - exposures interrupted by weather, frames with incorrect exposure times, or mislabeled frames. RRISA includes all of the night logs (digital and paper) for the IGRINS observations which can be found here. We highly recommend that users of the Raw archive consult the night logs for all observations to confirm which frames are suitable for science if users choose to reduce IGRINS raw data using their own pipeline.
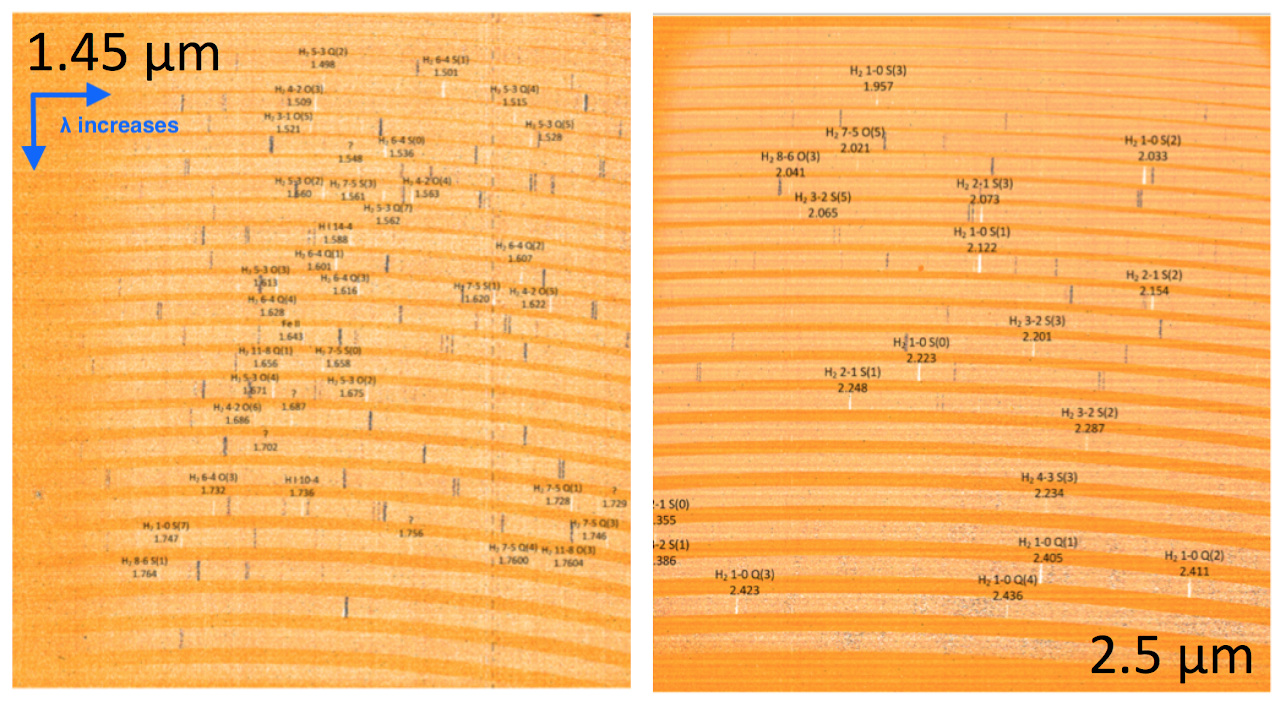
An example of the raw spectral frames for the IGRINS H- and K-band spectra can be seen below.

The IGRINS slit dimensions (width x length) in arcseconds are 0.34x5 at Gemini South, 0.63x9.3 at Lowell’s Discovery Telescope, and 1x15 at McDonald Observatory. Point sources (anything with a seeing limited image on the slit-viewer) are generally observed in two positions on the slit. The two positions, A and B, are separated by half a slit length.
Note: Data acquired between April 2018 and May 2019 were impacted by a slight K-band defocus. The details of the defocus are available at the IGRINS@Gemini webpage.
RRISA Raw
Downloadable from our GitHub as a .csv. Users can also view through Google Drive or explore the RRISA_v3 folder on Box!
For a more detailed description of the information included in RRISA Raw, check out the RRISA Raw folder on our GitHub.